What does our oil and gas industry have to learn from the federal government and use of geospatial technology? There’s always something to learn!
While attending Esri’s Federal User Conference the 24-25 of February, my first, it was interesting to observe the differences in culture and atmosphere of the Federal GIS People, and the similarities to the Petroleum GIS People– we compared, we contrasted, and we made observations.
Brothers and sisters in GIS:
What we saw were users of GIS, developers of GIS tools, and analysts of geospatial data, looking for new and improved ways to do their jobs, for which they get paid, each day they are working. Not much difference, here…
These users and managers of geospatial technology and data are just like “the you’s and the me’s” in the petroleum industry – we all need to analyze, spatially, a lot of information all at once – and we need to trust our information, and trust the results of the analysis and interpretation, then tell a story that people can understand to support a decision, one way or the other. Not everyone is a data nerd – some people need to be told the meaning of the numbers and results – even with a map.
Federal users are really not so much different from petroleum users of GIS, other than the differences in culture of business vs. government models of doing things. My assessment is that business moves faster, and users have to do work faster in order to yield results. But it gets complicated and it’s worth a good conversation to dig deeper.
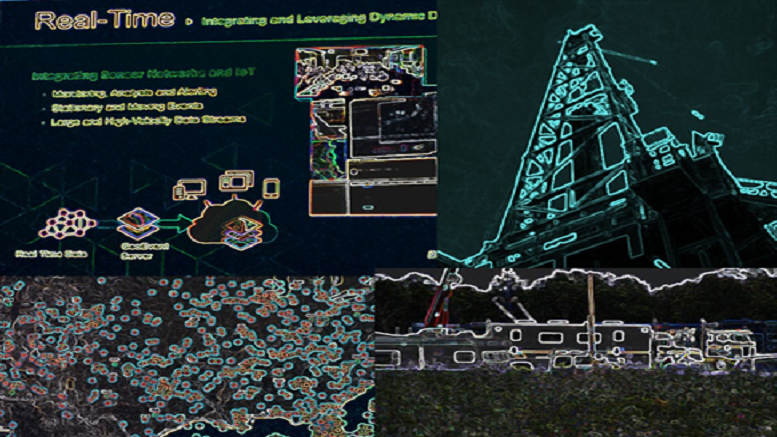
Story maps were the big thing, and so was “BIG data”.
The wiz-bang story is that now, Esri is putting more work into making it easier to plug in the “BIG data” sources and utilize the tools in the new versions to interact with this BIG data. Not being funny, but “This is BIG!” We saw one of our colleagues, Bruce Sanderson, stand on the big stage and talk about this last year. Bruce is known for tackling big data challenges and wins a lot of these by persistence and finding people who can work with him on the solution. Now we see the work that he and Esri began being spread and applied across verticals – which this writer truly enjoys seeing – collaboration and innovation, plus knowledge transfer.
Now we see that there is more focus and more coming on this in Esri’s new development efforts. Good thing, because there are lots of challenges to be met, and opportunities to be had if this is done well.
The Federal Government has been into understanding and sorting “BIG data” for years.
From the time of the first visions by astronauts on NASA missions looking down at “the blue marble”, marveling that in all of the dark space, the color blue was so distinctive, the photo taken became famous. From that era forward, the collection of remotely sensed and seen signals, images, and such have fascinated us and aided in solving the mysteries that were tough to tackle ahead of these discoveries.
Like satellite imagery and other remote sensing types of data, we see the commercialization maturing with “BIG data” coming more and more into the spatial view, when some of us have thought it has been a long time coming – when in the greater scheme of things, it has likely come at about the right time. Price point has been one consideration – acquisition and availability another, and timeliness yet another.
BIG Data introduced to the petroleum industry or just another spin on something that petroleum people have been dealing with for years?
“BIG data” began crawling up the hype curve, commercially, as a “new thing”, around 2008 or so, according to my first recollection of some of the IT providers making presentations about it and setting up shop in the petroleum industry. I remember the conversation, but not the exact date. It was some fellows from India, talking about Hadoop.
They talked about seismic data as being the BIG data source, and of course, I thought to myself, “Hmmmmm… I am not sure how I feel about a bunch of IT guys with no training in geophysics, starting to tackle seismic, but then again, sometimes a fresh approach can yield hidden gems…” Of course if we go down the rabbit hole of seismic data processing in this article, we will get into a whole different discussion. Save that for a different day and venue…
But increasingly, from 2010 forward, we have continued to see people stand up and talk about using “BIG data” in petroleum. Of course we think “SCADA” in the oil patch, and then other sensor driven data comes to mind immediately. There are lots of sensors and returns “as the drill bit turns”, and captured results from meters in the field on practically every well out there that is producing, or not.
We think production volumes, wellhead measurements like pressure and flow rates, and there is a plethora of those types of sensor values that many of us spatial geeks think could be valuable information when viewed on a map, in layers, with other information.
Seismic is BIG data, but not so much dynamic data, but seen in a different paradigm, especially with 3D coming into the mainstream of GIS use today, who knows what insights the combinations could yield? Why not be able to pull all of this together into GIS views? Very expensive interpretation systems have been doing this to a certain extent for years, but not as elegantly as we would hope we could do using these combinations in our GIS. We passionately believe that this should be easier to do in our favorite integration platform.
New products for data visualization with GIS for intelligence are now emerging from Esri’s development. Esri’s Insights was just announced at the Fed UC. This will be interesting to watch as it competes with the other BIG data crunchers out there such as Tableau and Spotfire.
So why now and not a few years ago?
Some people just take a while to warm up to the idea, that’s why. Petroleum people may be wildcatters, and not afraid of risk, but sometimes they are old fashioned thinkers in certain areas. Many prefer the tried and true — the traditional ways of doing things. Data interpretation and processing has historically had that “black box” mystique that puts some people off of even trying to understand the details. You hear people say, “Not in my paygrade”, simply stated. But this is changing.
The New Oil Patch?
This writer believes that with the current state of the industry, a transformation is going to happen when the industry cycle begins the next steady upturn. As we see this incorporation of the use of BIG data develop further within our geospatial technology space, in petroleum, this may in turn, introduce the utilization of BIG data to increasing numbers of GIS users in the oil patch. Likely, this is a good time for this to happen, we may see even more take-up in the engineering and operations areas of the oil patch than what we have seen thus far.
A picture can be worth a great deal, especially in a downturn, as an assist to operations. Telling the story of what’s going on through maps, using Story Maps to do this, could have a place in field operations and the home office at the same time. Think of the 7 AM meeting in the field office…with the same Story Map available to executives who want to drop in for a quick catch-up. A Story Map with highlights using a map, fed by real data – lots to think about here…
When the call for more efficiency gets louder and louder, we might be seeing more reliance on that BIG data to help in automating decisions. The opportunity to make certain that it is not big BAD data is going to increase. It is a narrow fence to walk down, to make certain that BIG data does not have BAD data included.


Be the first to comment on "What does our oil and gas industry have to learn from the federal government and use of geospatial technology?"