Part 1 of 4
I have spent many years working in GIS progressively through versions of various brands of GIS, pushing data into it and working with developers in “pushing the envelope” on working with data in GIS. My team at one company did some pretty remarkable things as we had business demands and requirements from people in our E&P teams (including reservoir engineers) who saw the value of bringing all of their data into GIS such that they could see it all in one place. Long associated with geology, and land, GIS can confidently be utilized in virtually every area of the petroleum business life-cycle.
How people come to use GIS… (Usually) – The short of it…
People come to use GIS because it does what they want it to do and more, as they discover as they become proficient and confident in their use of it. With GIS, the capability to bring together diverse data into one view is easier than other applications that enable visualization, and this can be done at a fraction of the cost.
With some of the high-end visualization software in the market, today, especially in the petroleum software market, bringing data together “ad hoc” often requires a specialized process, and specifically trained support people to conduct them. More and more, bringing data into a GIS has become an attractive integration approach. E&P data that can be visualized includes any data with or related to a location – spreadsheet information, land and mineral ownership data, various geological data, well and field characteristics, and other “layers” – subsurface (minerals interests) and surface (access rights) land, drill plans, and the various information layers needed to manage E&P projects along their life-cycle to maturity. It is a shorter list of data types that cannot be brought into GIS tools for analysis.
People, no matter what their discipline – once they “get it” – want to use GIS
Once exposed to GIS, often, people within the engineering functions of a company want to see their data integrated into a 2D or 3D map, especially when it reaches the point of “concept realization”. These engineer want to visualize other teammates’ data, relative to theirs, on a map, and have the analytical functions that are available to them in GIS in order to see the “whole picture”, especially in various scenarios. “What-if” modeling of a field to “see” what the concept would look like can provide powerful decision support.
One function, the composite risk segmentation analysis (CRS) proves to be a very powerful “winner” for collaboration and visualization between engineers and geologists in viewing and high-grading fields, reservoirs and prospects. GIS visualization makes the analysis results, formerly on a spreadsheet type report, “jump to life” on the screen. Teams can model real-time, see results in a map view, and to be able to flip between different scenarios.
In the past, it was our experience that the mid-level GIS user found difficulty working in 3D, but with certain GIS extensions, this capability could be attained. Sub-surface, however, was not easily attained. Today, this is becoming easier and a wider range of possibilities are coming forward, for more types of data that are used in the industry. Sub-surface 3D visualization in GIS is now possible.
Picture credits:
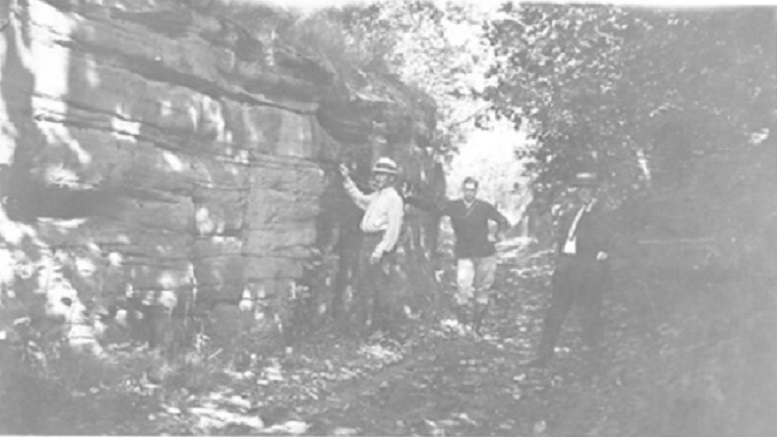
1920’s Oil Field Planning and Derricks on Fire – by J.K. Wallingford 1921, owned by the author – ellenspictures © all rights reserved
Paleo-technic Engineer – by Callum Shand – used with permission;


Be the first to comment on "The use of GIS in petroleum reservoir engineering – is there uptake? If not, what’s the problem?"