Part 3 of 4
GIS and how data gets into it – GIS interoperability
Most GIS data entry these days is becoming less manual, and more and more focused on moving it directly from sensor or capture device into the GIS data environment via synchronization or extract-transform-load (ETL) from source systems or software databases. OpenSpirit is one example of this in the “oil patch”. There are others. SAFE Software’s FME extends interoperability that enables spatial ETL’s. Many other software packages have “hooks” to spatial using OGC compliant parts. However, this gets into more of the data handling side of GIS vs. the analytical user side.
Business users of GIS are focused on results, more often, not the “data manipulations and reformations” that are ahead of those important results. Results are delivered by working with the data and understanding the relationships between data types where attributes were depicted in layers – e.g., seismic and logs, or understanding porosity across a reservoir by visualizing the well data in a GIS view that is 3D utilizing symbols or production, using symbols that indicate GOR.
The “horse to water” problem in understanding GIS – you can’t fix “stubborn”
Of course there are people on the engineering staff who do not appreciate the GIS – and would not extend themselves to learn what it was about. Many assume that it is just another flavor of CAD, or that PowerPoint would work just as well.
Once, we had one engineering manager tell us that if he needed his map symbols to appear differently, he could get his admin to change the colors in PowerPoint. He refused to realize that the symbols on the map were changing because the data changed. We even did a “live demo” for him. He was not impressed.
We explained that changing symbols actually were the result of changing data – we were not clicking on the symbol and selecting red vs. blue. We showed him the data table in GIS, made a change to the data, and showed resulting changes in the map – but by then, he wasn’t listening. We had a PICNIC problem. “Problem in chair, not in computer”… He was one stubborn dude…
We learned that some people could not work with data in three “dimensions” of visualization– row + column + geometry, and could not visualize the capabilities of GIS – the business described in “layers” of data fabric. Many of our GIS peers have worked with a number of these people through the years. A colleague of ours from Scotland calls them “paleo-technic engineers”. It’s a culture problem more than anything else, and at times the line “we have always done it this way” prevents the adoption of change.
Picture credits:
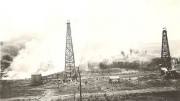
1920’s Oil Field Planning and Derricks on Fire – by J.K. Wallingford 1921, owned by the author – ellenspictures © all rights reserved
Paleo-technic Engineer – by Callum Shand – used with permission;


Be the first to comment on "The use of GIS in petroleum reservoir engineering – is there uptake? If not, what’s the problem?"